   |
Cytoscape: ON | Sign In |
Searching...
NeuroGeM
Help Page
* Please note that this site is best viewed in Chrome and FireFox. Internet Explorer users may have compatibility issues.
NeuroGeM provides several search methods  ~
~  and
a download page
and
a download page  .
.

|
|
Search by keyword |
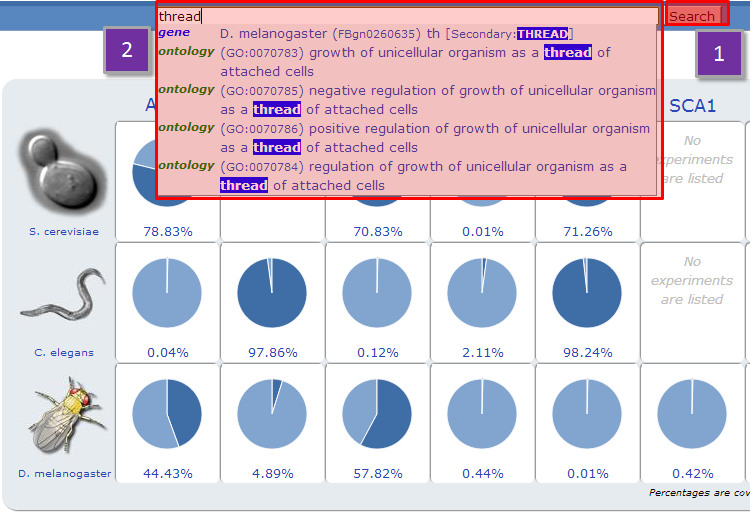
Type any keywords in the search box and NeuroGeM will search for matching genes by gene ID, gene name, synonym, GeneOntology term, ID used in other databases such as UniProt, EMBL, etc. Typing keywords and pressing enter in the text box will lead you to a page with a list of matching genes. Alternatively, NeuroGeM is also implemented with a suggestion box that will provide gene and ontology suggestions as keywords are typed into the search box. Picking one of the suggested genes will direct you to the corresponding gene information page. Picking a GeneOntology term in the suggestion box evokes an ontology-based relation search (see Search with advanced options).
|
|
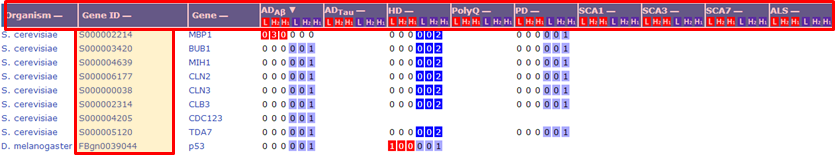
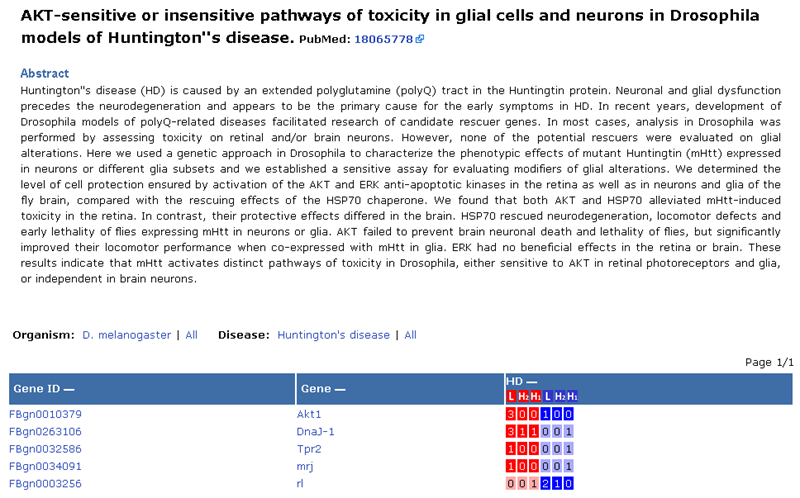
NeuroGeM returns a list of all the gene entries that contain the queried keyword. |

Clicking the the column headers of the search result table allows the user to sort the genes by organism ("Organism"), gene ID ("Gene ID"), gene name ("Gene"), or the number of experimental records (disease models).
Under each column that corresponds to a specific disease model, the values denote the number of experimental records performed at their respective experimental scales (L stands for low-throughput, H2 for secondary high-throughput, and H1 for primary high-throughput). The numbers of experimental records that identified genes as modifiers are shown in red, whereas those that identified genes as non-modifiers are shown in blue.
Clicking a gene ID
or gene name directs the user to a gene specific page as shown below with the following label  .
.
Although the current version of NeuroGeM compiles
modifiers from D. melanogaster, C. elegans and S. cerevisiae, it also allows users to search for H. sapiens and M. musculus genes. Such queries will return not only the queried genes but also their homologous genes in the three model organisms, which will be useful for researchers who are interested in neurodegenerative diseases in higher organisms. Gene information on H. sapiens and M. musculus was obtained from EMBL, HGNC and MGI, and protein interaction data was obtained from STRING.
Modifiers in higher organisms will be added at later stage.
|
|
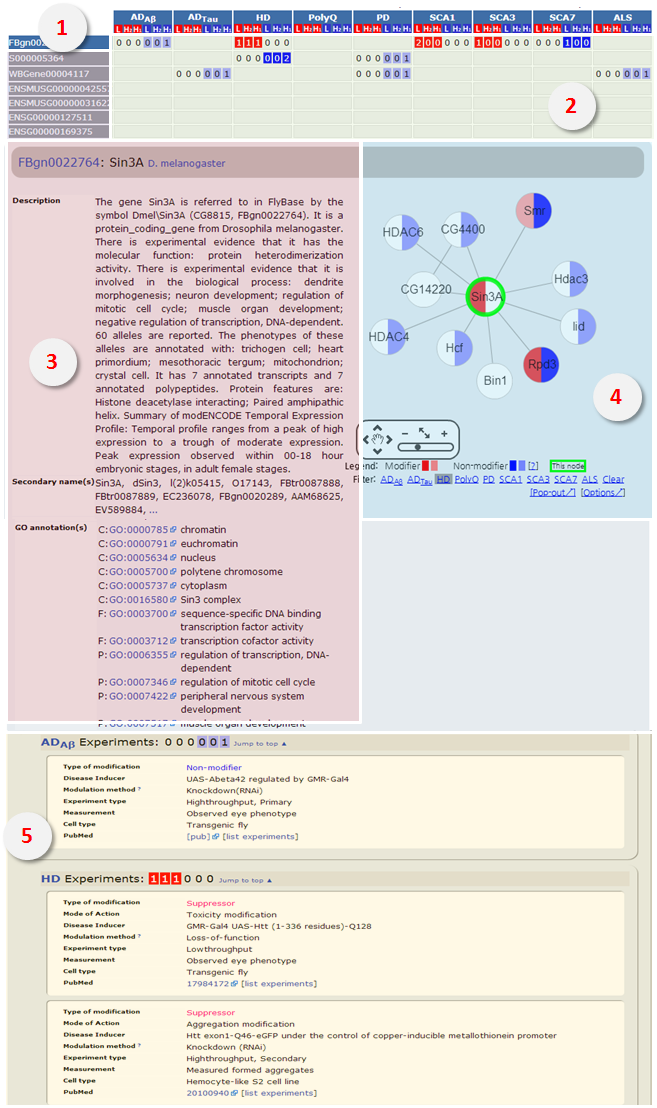
Gene information page displays protein function, names and synonyms, protein interaction network, and information on the experiments. |
|
|
|
|
|
|
|
|
|
|
|
- [Filter]: The nodes are colored by respective disease model
- [Pop-out]: Users can open the network in a new window. Clicking a node in the network opens corresponding gene information page. - [Option]: Users can turn off network display, limit the number of nodes that are displayed, and adjust the cutoff threshold of interaction confidence. Once set, the changed options are stored and applied to all protein networks. |
|
|
|


|
|
Search
with advanced options |

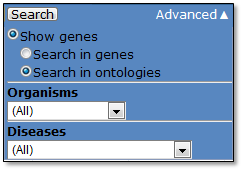
- Show genes
Search in genes (default):
As explained above, this option returns genes that match the queried keyword.
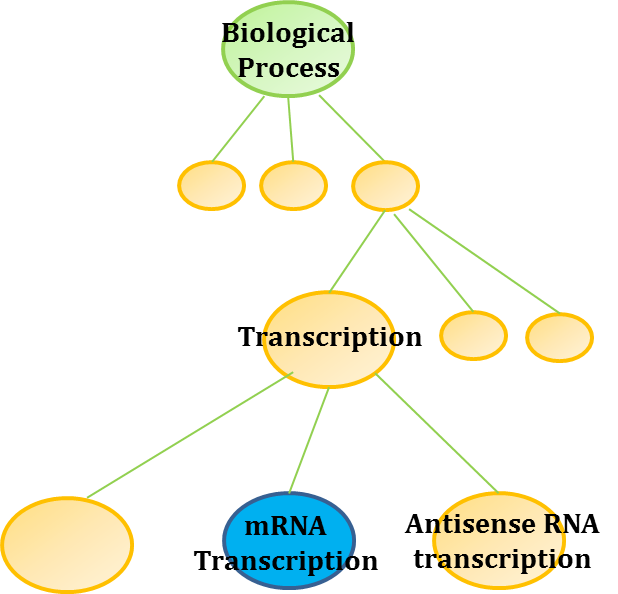
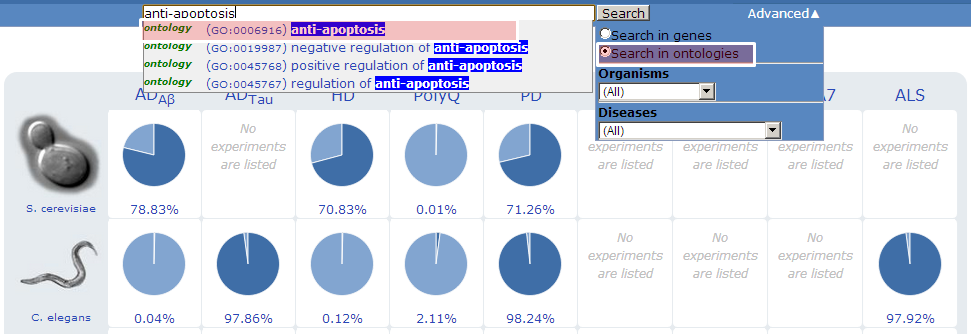
Search in ontologies:
Advanced search allows users to search by the hierarchical structure of GeneOntology terms. For example, searching “Transcription” by GeneOntology returns a list of genes that are annotated with “Transcription” as well as those annotated with its child nodes such as “mRNA transcription” and “Antisense RNA transcription”.
In
order to perform an ontology-based relation search, click “Advanced” button and select “Search in ontologies”.
Type any keyword in the search text box. Then pick an ontology term from the suggestion box or simply press enter to search for any genes annotated with a matching term or a matching child term. NeuroGeM will return the list of genes that are annotated with any of the matched terms.
- Others
In “Advanced” menu, users can limit search results by selecting filtering options under two different categories (organism and disease model).
|
|
Search
by categories |
Users
can search genes by two categories: organisms and disease models. Clicking the icon of S. cerevisiae, C. elegans or D. melanogaster returns a list of publications that had been conducted in that organism. Clicking one of the publications returns a list of tested genes from that literature. Likewise, clicking a pie chart in the front page returns a list of published experiments on the corresponding disease and organism. The percentage below each pie chart represents the coverage of investigated genes over the whole protein coding sequence in the species.
For
example, clicking a pie chart in HD(Huntington’s disease) in D.
melanogaster will reveal a list of publications that have identified genes in that disease model and organism.
Selecting a publication returns the details of that publication and a list
of genes that have been identified in that
literature.

|
|
Download
NeuroGeM |
Tab-separated text files are available at the download page (link).
The available text files are: information on the experiments; gene information processed from FlyBase, SGD, WormBase, EMBL, MGI, and HGNC; GeneOntology annotations; homologous genes from NCBI HomoloGenes and InParanoid; and protein interactions from STRING.